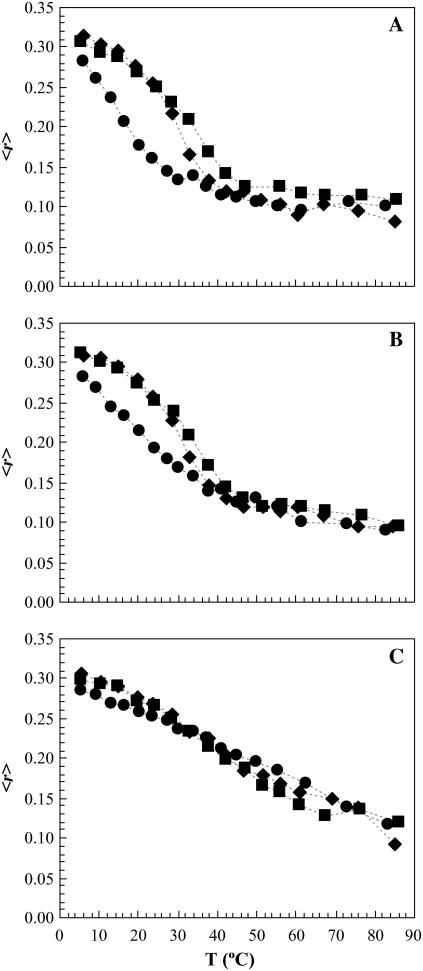
FIGURE 5.
Variation of t-PnA fluorescence anisotropy with temperature for (A) POPC/PSM/Chol: 0.72:0.23:0.05 molar ratio, (B) POPC/PSM/Chol: 0.60:0.26:0.14 molar ratio, and (C) POPC/PSM/Chol: 0.25:0.35:0.40 molar ratio, containing 0 (circles), 2 (diamonds), and 4 (squares) mol % PCer. The dotted lines are only a guide to the eye. The Tm was taken by the midpoint of the intersection of the lines describing the initial (gel), intermediate (gel and fluid), and final (fluid) regimes (see de Almeida et al. (23) for additional details).

