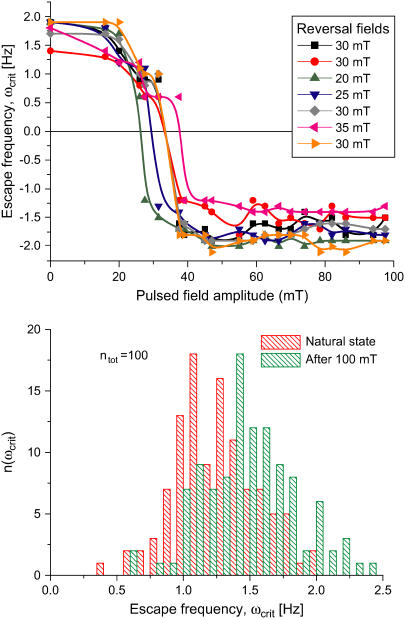
FIGURE 4.
Pulsed-field remanence measurements on MMPs. (Top) Remanence magnetization curves of individual organisms resulting from a sequence of remanent moment measurements and pulses applied opposite to a weak alignment field. The remanent magnetic dipole moment is expressed in terms of the escape frequency ωcrit (see Eq. 5). Note that the initial values of ωcrit (MMPs in the natural state) are close to the final values in each curve (after treatment with a pulse of 1000 Oe). The DMO is obtained from the ratio between the initial and the final ωcrit values, as 90%. (Bottom) Distribution of ωcrit from ensemble measurements. The frequency distribution n(ωcrit) in the natural state is centered at  and increases only slightly after pulsing (100 mT), with a new mean of
  (n = 109). The ensemble DMO amounts to 85% (Eq. 6).

