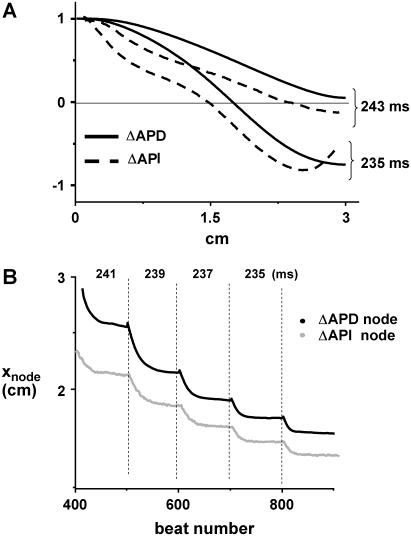
FIGURE 11.
Comparison of the spatial distribution of ΔAPA and ΔAPI alternans. (A) Steady-state spatial distribution of ΔAPA and ΔAPI alternans at 243 and 235 ms. The ionic model used is the same as that used for Fig. 1. (B) Nodal line position versus beat number during a dynamic pacing protocol where PCL is decremented by 2 ms every 100 beats.

