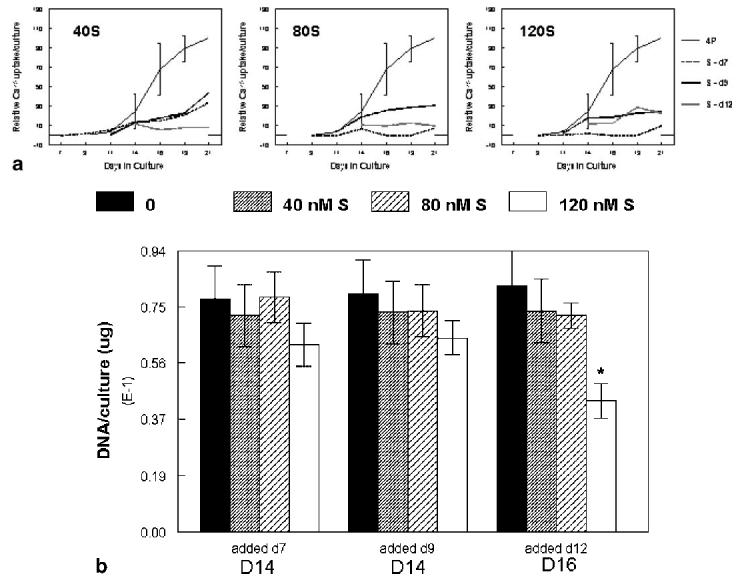
Fig. 1.

a: Pilot studies to determine effects of time of addition and concentration of staurosporine on 45Ca uptake. Mineral ion uptake was monitored in control mineralizing cultures (4P) and mineralizing cultures to which the apoptosis inducer was added at 40 (left), 80 (middle), or 120 (right) nM from day 7, 9, or 11. Error bars show mean ±SD for n = 3; duplicate experiments are provided for the other curves. All data was fitted by a non-linear sigmoid curve regression. b: DNA content (μg/culture) in the pilot study. Treatment groups are indicated on the x-axis; DNA measurements were performed at day 14 for cultures treated at day 7 or 9, and on day 16 for cultures treated on day 11. Error bars show mean ±SD for n = 3 determinations. *P < 0.05 relative to untreated control.
