
Fig. 3.
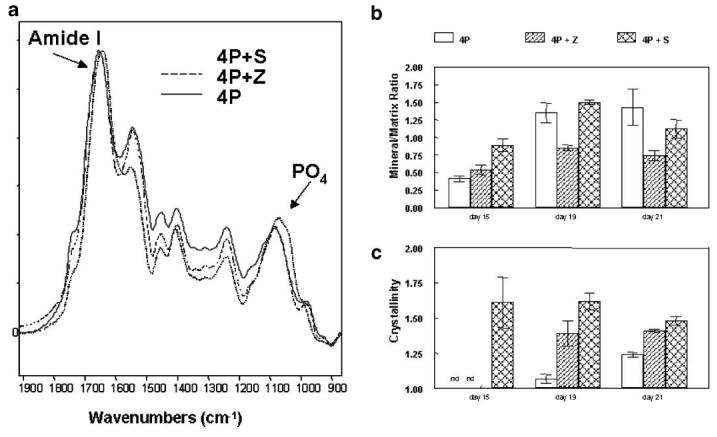
Infrared spectroscopic analysis of representative cultures: (a) Typical spectra from the three culture systems at day 21. All spectra were normalized so that the amide I bands were superimposed. The phosphate and amide I bands used for detailed analyses are indicated. b: Mineral:matrix ratios calculated from all spectra obtained as a function of time. Values are mean ±SD for n = 3-7 spectra from different cultures. c: Crystallinity, calculated from the peak intensity ratios of bands at 1,030 and 1,020/cm respectively. Values are mean ±SD for n = 3-7 spectra from different cultures.