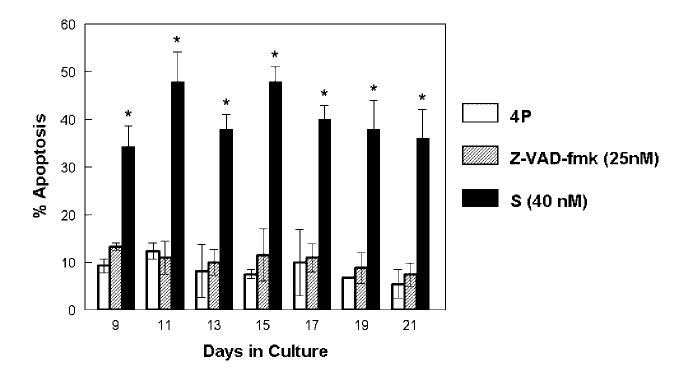
Fig. 6.
Flow cytometry using Annexin V to determine the percentage of apoptosis at various time points for mineralizing controls (4P), Z-VAD-fmk (25 nM) treated cultures, and 40 nM staurosporine treated cultures (4P + S) is shown. Cultures treated with the apoptosis inhibitor continuously from day 7 showed no significant difference compared to control. Cultures treated continuously with the apoptosis stimulator showed significant increase in apoptosis levels compared to control. (*P =0.05 relative to control mineralizing cultures).

