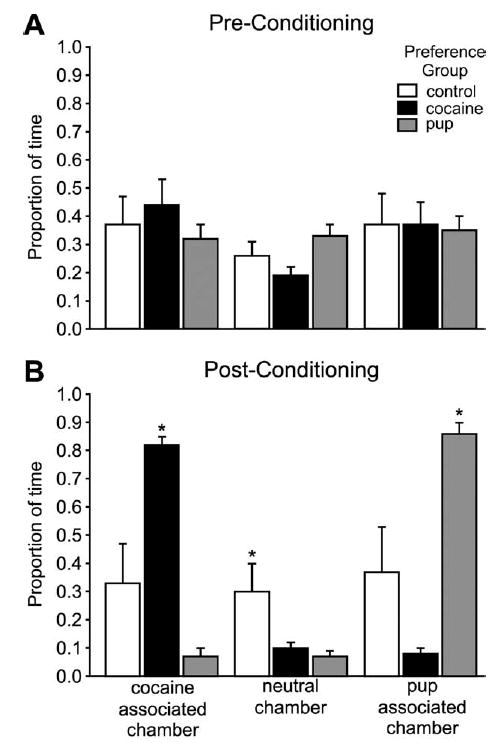
Fig. 2.

Behavioral data. (A) Mean (±S.E.M.) proportion of time spent by the dams in each stimulus-associated cues before the conditioning phase of the place preference procedure. (B) Mean (±S.E.M.) proportion of time spent by the dams in each stimulus-associated cues after conditioning, during the place preference test. Asterisks indicate a significant difference between groups in each stimulus-associated cues, P<0.05.
