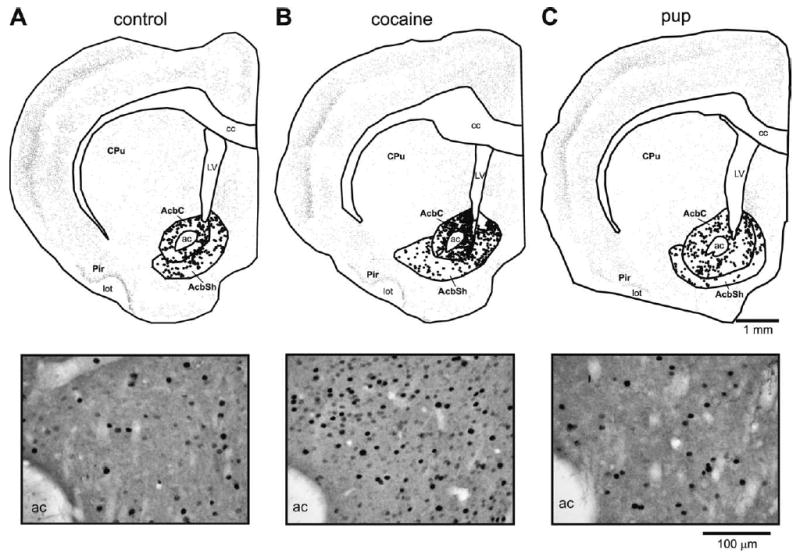
Fig. 4.

Top: Anatomically exact Neurolucida-generated illustrations of representative sections from each preference group in the Acb at bregma level + 1.6 mm; other details of figure as in Fig. 3. Bottom: Black and white photomicrographs from the same sections as the Neurolucida maps.
