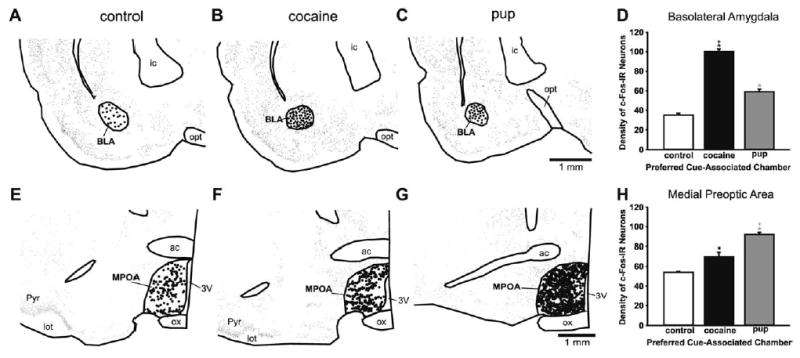
Fig. 6.

Top: Anatomically exact Neurolucida-generated illustrations of representative sections in the basolateral amygdala at bregma level −1.8 mm from the control group and each preference group; further illustration details as in Fig. 3. (A) Control group. (B) Cocaine-associated cues. (C) Pup-associated cues. (D) Histograms show the mean (±S.E.M.) number of c-Fos-IR neurons in the basolateral amygdala. Bottom: Anatomically exact Neurolucida-generated illustrations of representative cross-sections in the MPOA at bregma level −0.30 mm for each preference group, illustration details as in Fig. 3. (E) Control. (F) Cocaine-associated cues. (G) Pup-associated cues. (H) Number of c-Fos-IR neurons in the MPOA. Histograms from each preference group show the mean (±S.E.M.) number of c-Fos-IR neurons. All asterisks indicate a significant difference from the control group, P<0.05. Plus signs indicate a significant difference between the experimental groups, P<0.05. Statistical details in the Results.
