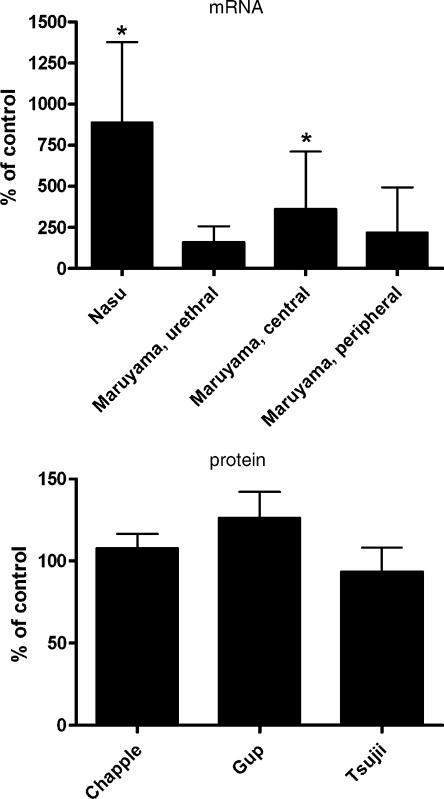
Figure 5.
α1A-Adrenoceptor mRNA (upper panel) and total α1-adrenoceptor protein expression (lower panel) in prostates from BPH patients. Data are expressed as % of the corresponding control group and taken from Chapple et al. (1989); Gup et al. (1990); Tsujii et al. (1992); Nasu et al. (1996); Moriyama et al. (1998). *P<0.05 vs control in the respective study. Note that Moriyama et al. have studied the urethral, central and peripheral zones in parallel.

