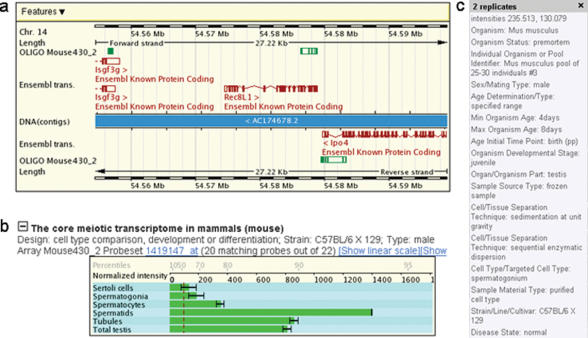
Figure 2.
Genome annotation and MG 430 2.0 GeneChip expression profiling data for Rec8L1 in mouse. The chromosome number is indicated. (a) On a genomic map, Rec8L1 and its neighbouring genes as annotated by Ensembl, and the gene-specific MG 430 2.0 array probe target sequences (OLIGO Mouse430_2) are shown in red and green, respectively. (b) Normalized linear (or log2 transformed) expression signals obtained with MG430 2.0 arrays and testicular mouse samples as indicated are shown in a bar diagram. Expression signals of individual genes are correlated with all other signals on the array via the percentile scale. The dotted red line indicates an empirical signal threshold level for background noise.

