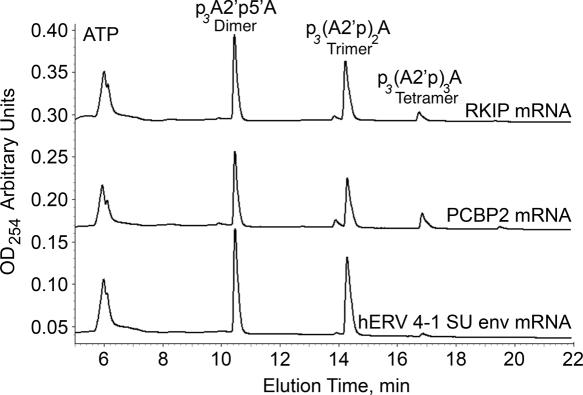
Figure 8.
2-5A oligomer distribution as determined by HPLC of OAS reaction products using as activator, RKIP, PCBP2 and hERV 4-1 SU env RNAs as indicated. Reactions were at 37°C for 2 h. The y-axis, optical density at 254 nm, is translated upward for the clarity of data. Positions of 2-5A dimer p3A2′p5′A, trimer p3(A2′p)2A and tetramer p3(A2′p)3A are indicated.

