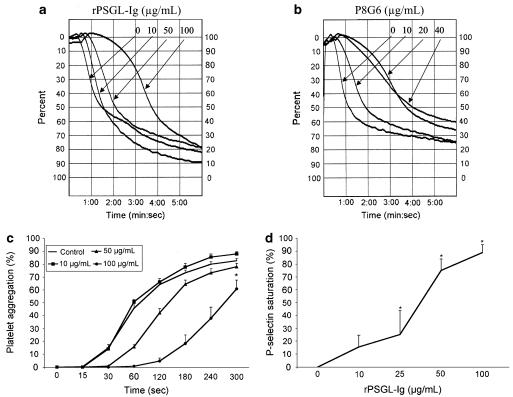
Figure 2.
Representative traces illustrating the aggregation response of thrombin-stimulated platelets in the presence of increasing concentrations of rPSGL-Ig (a) or the blocking P-selectin Mab P8G6 (b). (c) The average effect of rPSGL-Ig on the kinetics of thrombin-induced platelet aggregation (n=6–9, *P<0.05, 100 μg ml−1 rPSGL-Ig vs control, repeated ANOVA and Dunnett's test). (d) The percentage of P-selectin saturation in the presence of increasing concentrations of rPSGL-Ig (10–100 μg ml−1) (n=3, *P<0.05 vs 0, ANOVA).

