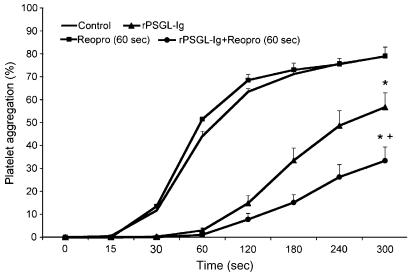
Figure 5.
Platelet aggregation with Reopro added 60 s after the onset of the aggregation process. Thrombin 0.025 U ml−1 (control, straight, n=5), rPSGL-Ig (triangle, n=5), Reopro alone added at 60 s (square, n=3), and rPSGL-Ig with Reopro added at 60 s (circle, n=5) (*P<0.05 vs control and Reopro alone, +P<0.05 vs rPSGL-Ig, Student's t-test, ANOVA).

