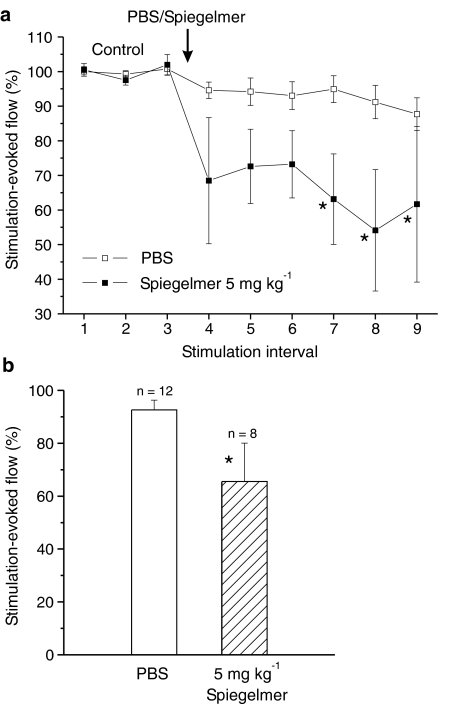
Figure 3.
Mean increases in flow evoked by electrical stimulation before (control) and after i.v. injection of PBS or CGRP-binding Spiegelmer NOX-C89 onto the exposed dura. (a) Flow increases (normalised to the mean of the control responses) and their variation after administration of PBS or NOX-C89 (5 mg kg−1); *significant difference to all three control values (P<0.05, ANOVA). (b) Normalised and averaged flow responses of six stimulation intervals after administration of PBS or NOX-C89; *significant difference to PBS.

