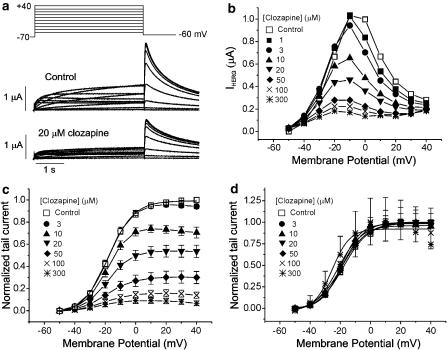
Figure 1.
Effect of clozapine on human ether-a-go-go-related gene (HERG) currents (IHERG) elicited by depolarizing voltage pulses. (a) Superimposed current traces elicited by 4-s depolarizing voltage pulses in 10 mV steps (upper panel) from a holding potential of −70 mV in the absence of clozapine (control, middle panel) and in the presence of 20 μM clozapine (lower panel). (b) Plot of the HERG current (IHERG) measured at the end of depolarizing pulses against the pulse potential seen with different concentrations of clozapine. (c) Plot of the normalized tail current measured at its peak just after repolarization. The amplitude of the tail current in the absence of the drug was taken as 1. Control data were fitted to the Boltzmann equation, y=1/{1+exp[(−V+V1/2) /dx]} with V1/2 of −18.0 mV. (d) Activation curves with values normalized to the respective maximum value at each concentration of clozapine. Symbols with error bars represent means±s.e.m (n=8).

