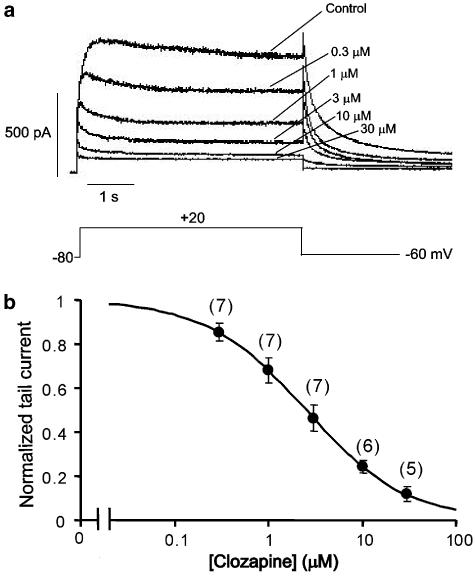
Figure 6.
Clozapine-induced blockade of HERG channels constitutively expressed in HEK293 cells. (a) Representative current traces recorded from HEK293 cells after application of clozapine. (b) Concentration-dependent blockade of HERG current. HERG tail-current amplitude was normalized to the control and plotted as a function of clozapine concentration. Data were fitted with the Hill equation, giving a half-maximal inhibitory concentration (IC50) of 2.5 μM and a Hill coefficient of 0.82 at +20 mV. Numbers in parentheses represent the number of cells.

