FIGURE 2—
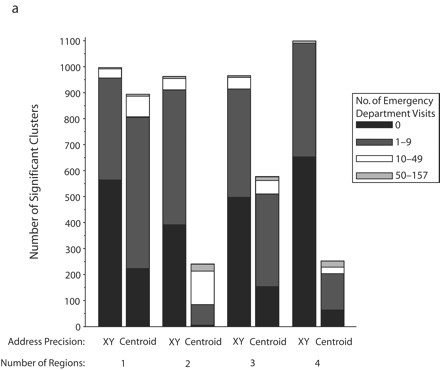
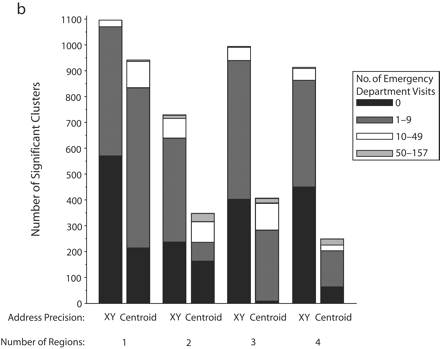
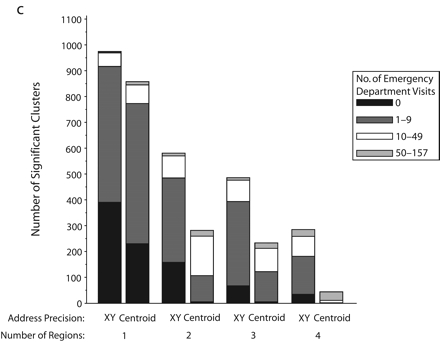
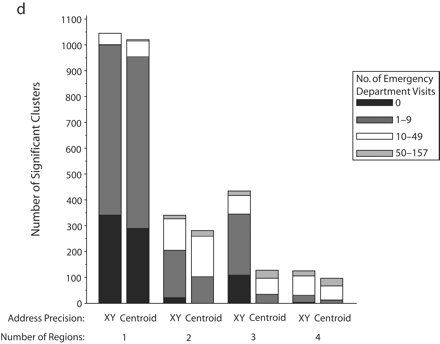
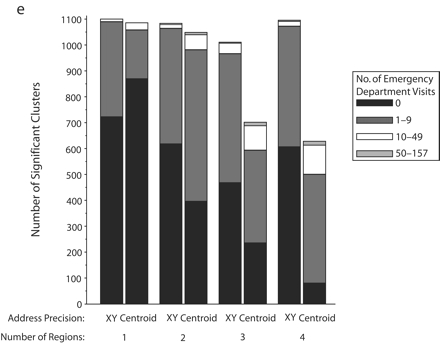
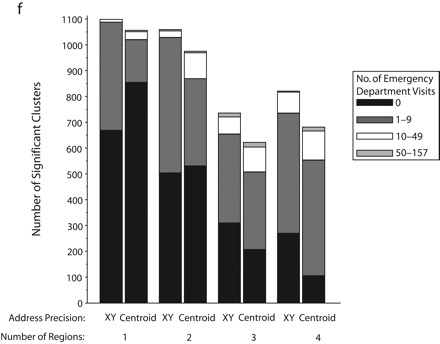
Significant SaTScan clusters that contained at least half of the simulated cluster points, by type of administrative region and radius size of the simulated cluster: zip code area, 0.5-km radius (a); zip code area, 1-km radius (b); zip code area, 2-km radius (c); zip code area, 3-km radius (d); census tract, 0.5-km radius (e); and census tract, 1-km radius (f).
Note. Pairs of bars compare clusters identified by SaTScan when points were analyzed at two levels of address precision, as either exact x-y coordinates or as centroids of administrative regions (zip codes or census tracts). The height of the bars indicates the number of significant clusters that contained at least half (5–10) of the simulated points that were inserted into the data. Bands within the bars indicate the number of additional points in the clusters that came from the background emergency department visits. Number of regions refers to the number of administrative regions into which the simulated cluster points fell.
