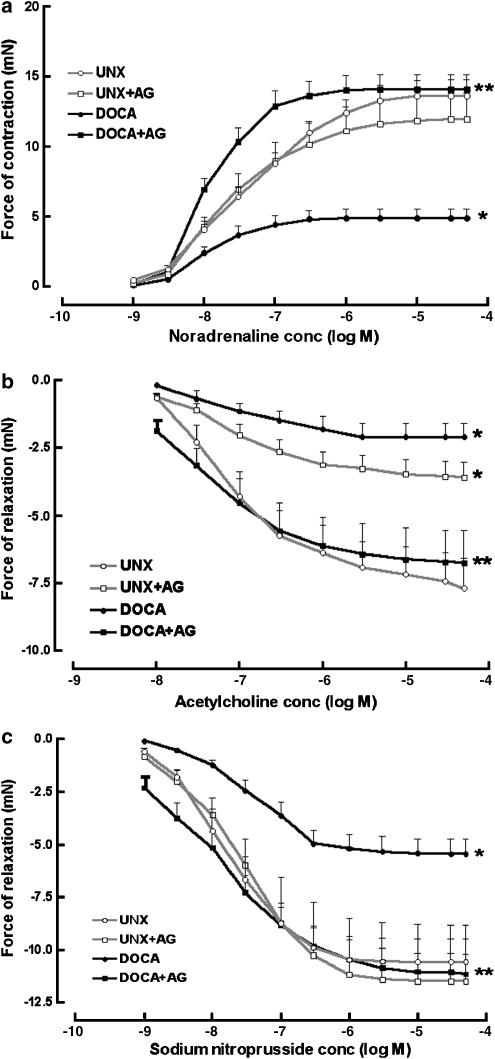
Figure 2.
Concentration–response curves to noradrenaline (a) for UNX rats (−log EC50 7.4±0.1, n=9), UNX rats treated with AG (−log EC50 7.7±0.1, n=7), DOCA-salt rats (−log EC50 7.8±0.1, n=9) and DOCA-salt rats treated with AG (−log EC50 8.0±0.1, n=7). Concentration–response curves to acetylcholine (b) for UNX rats (−log EC50 7.0±0.1, n=9), UNX rats treated with AG (−log EC50 7.1±0.2, n=7), DOCA-salt rats (−log EC50 7.0±0.1, n=9) and DOCA-salt rats treated with AG (−log EC50 7.6±0.2 n=7). Concentration-response curves to sodium nitroprusside (c) for UNX rats (−log EC50 7.8±0.1, n=9), UNX rats treated with AG (−log EC50 7.7±0.1, n=7), DOCA-salt rats (−log EC50 7.4±0.1, n=9) and DOCA-salt rats treated with AG (−log EC50 8.0±0.2, n=7). Values are mean±s.e.m.; Significance: *P<0.05 vs UNX rats; **P<0.05 vs DOCA-salt rats.

