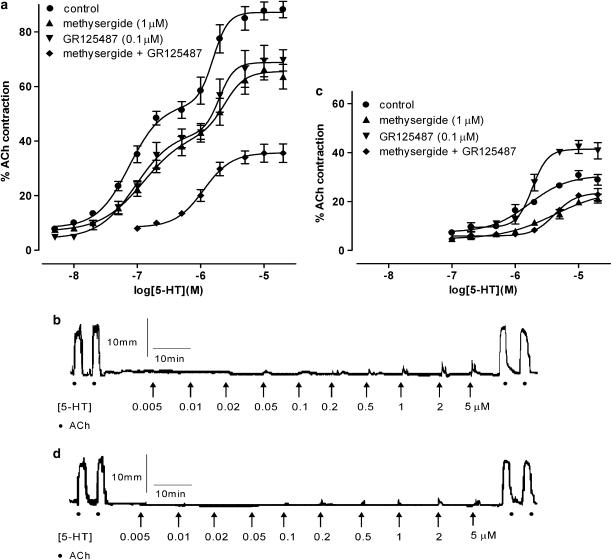
Figure 2.
Concentration–response curves and typical traces for the rat small intestine. Concentration–response curves of the rat jeunum (a; n=8–10) and ileum (c; n=6–10) to 5-HT in the absence or presence of methysergide (1 μM), GR125487 (0.1 μM) or both. Each point represents the mean±s.e.m. Typical trace showing contractile responses as a result of discrete additions of acetylcholine 1 μM and 5-HT (0.005–20 μM) in the presence of methysergide (1 μM) and GR125487 (0.1 μM) in the (b) rat jejunum and (d) rat ileum.

