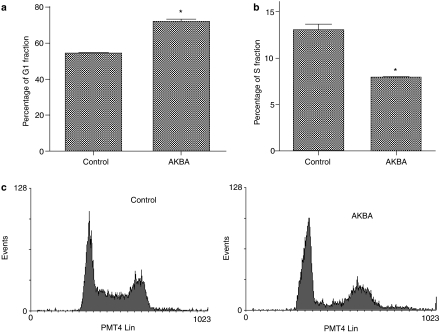
Figure 3.
AKBA caused a G1 arrest in HCT-116 cells. HCT1-116 cells were treated with 20 μM AKBA for 48 h. DNA was stained with propidium iodide and analyzed by flow cytometry. (a) Percentage of G1 phase cells in AKBA treated and control cells; (b) percentage of S phase cells in AKBA treated and control cells; (c) representative flow cytometric histogram in AKBA treated and control cells. Experiments were performed in triplicates. Results are expressed as mean±s.d. and are representative of at least three separate experiments. *P<0.05 compared to control.

