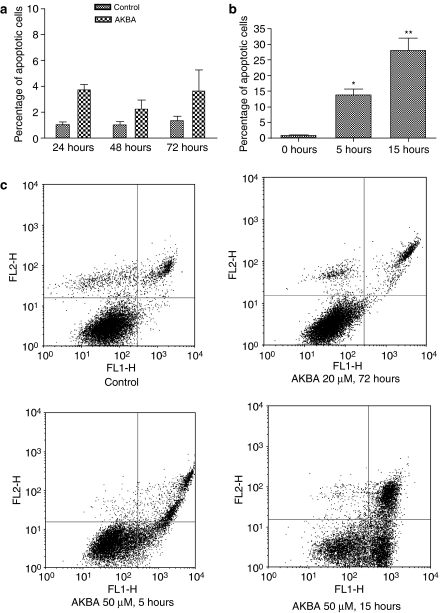
Figure 4.
Apoptosis assayed by annexin V and propidium iodide staining. (a) Percentage of apoptotic HCT-116 cells after treatment with 20 μM AKBA for 24, 48 and 72 h; (b) percentage of apoptotic HCT-116 cells after treatment with 50 μM AKBA for 5 and 15 h; (c) representative density plots of flow cytometric data. Results are expressed as mean±s.d. and are representative of at least three separate experiments. *P<0.05 compared to control. **P<0.01 compared to control.

