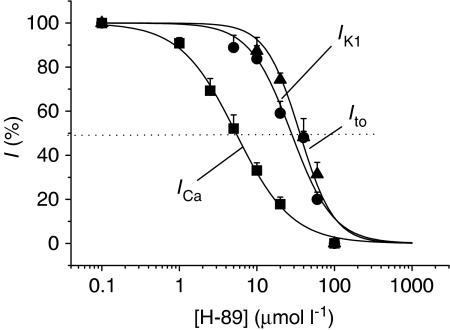
Figure 4.
Comparison of concentration–effect curves for the effects of H-89 on Ito, IK1 and ICa in isolated rat ventricular myocytes. Data on IK1 and Ito was obtained voltage steps (Figures 2 and 3), whereas data for ICa are replotted from the accompanying paper. Each point is mean±s.e.m. of at least five separate observations.

