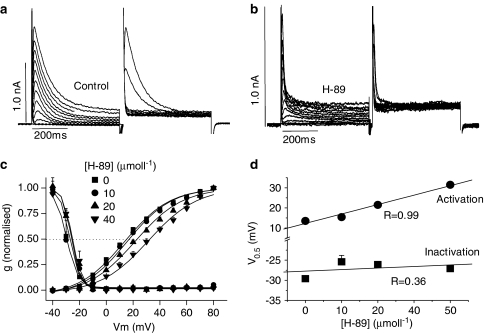
Figure 6.
Effects of H-89 on steady-state activation and inactivation of Ito. (a) Ito recorded during paired-pulse stimulation in control conditions. (b) Ito in the presence of H-89. (c) Steady-state activation and inactivation curves in the presence of 0, 10, 20 and 40 μmol l−1 H-89. (d) Half-maximal voltage (V0.5) for activation and inactivation, obtained using the Boltzman function, in the absence and presence of different concentrations of H-89. Each data point is mean±s.e.m. of 4–12 observations. V0.5 for activation was significantly different at 40 and 60 μmol l−1 H-89 (P<0.05).

