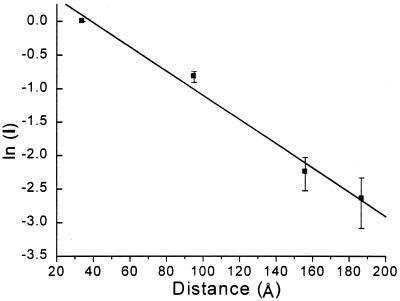
Figure 3.
Semi-log plot of cleavage intensity after piperidine treatment of irradiated AQ-DNA(1)/5′-32P-DNA(2) determined by counting the radioactivity with a β-detector. The measured counts in each band were normalized so that G10 ≡ 1.0. The distance scale was calculated assuming an average distance of 3.4 Å between base pairs. The error bars represent standard deviations calculated from four independent experiments.

