
Figure 4.
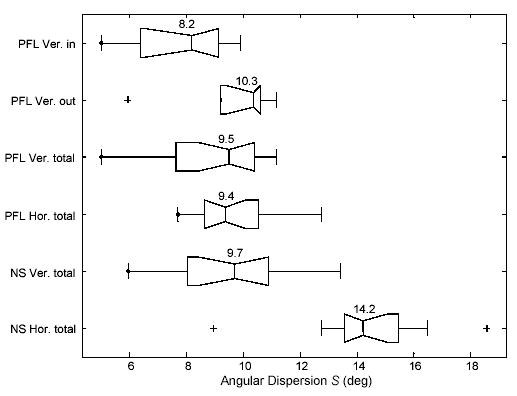
Box plots of angular eye position dispersion in normally-sighted subjects (NS) and PFL patients. Data are segmented by environmental condition: indoors (in), outdoors (out) and overall (total of in and out); and by dispersion component: vertical (Ver.) and horizontal (Hor.). Values for the sample medians and quartiles are displayed in the boxes and the whiskers represent the rest of the sample (unless there are outliers). The few “+” symbols represent outliers, values more than 1.5 times the interquartile range away from the top or bottom of the box.