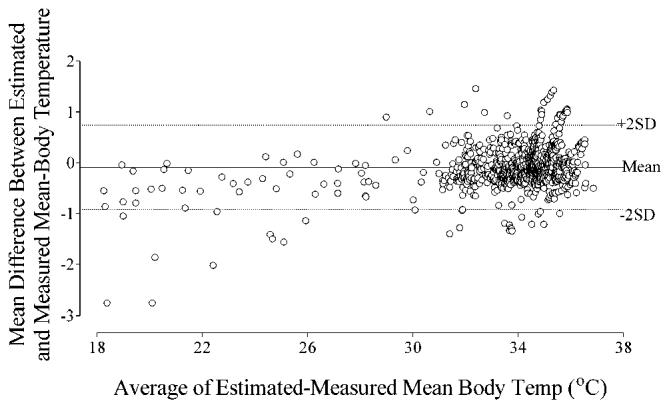
Fig. 2.

Bland-Altman plot for all 913 data pairs from all four studies.9-12 The bias (average difference between estimated and measured mean-body temperature) is - 0.09 ± 0.42°C, solid line on figure, (95% confidence interval -0.12 to -0.06°C). The precision (average of the absolute value of the difference between estimated and measured mean-body temperature) is 0.31 ± 0.29, (95% confidence interval -0.29 to 0.33°C). Over the entire dataset, 87% of the mean-body temperature estimates were within 0.5°C of the measured values.
