
Figure 2.
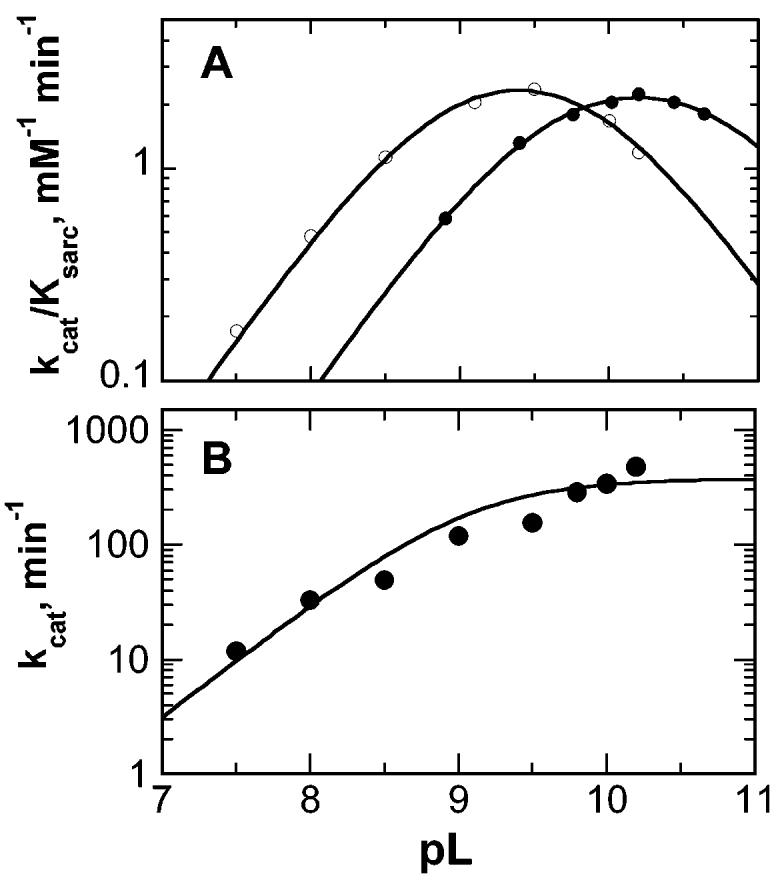
pH profiles with sarcosine as a substrate for MTOX. (A) kcat/Ksarc values in H2O (○) and D2O (●). The lines are from fits of the data to eq 4. (B) kcat pH profile. The line is from a fit of the data to eq 5. Conditions (A and B): 0.1 M ACES, 52 mM Tris, 52 mM ethanolamine-HCl, and 1 M KCl at 25 °C. The average error in the data for each profile is indicated by the size of the circles.