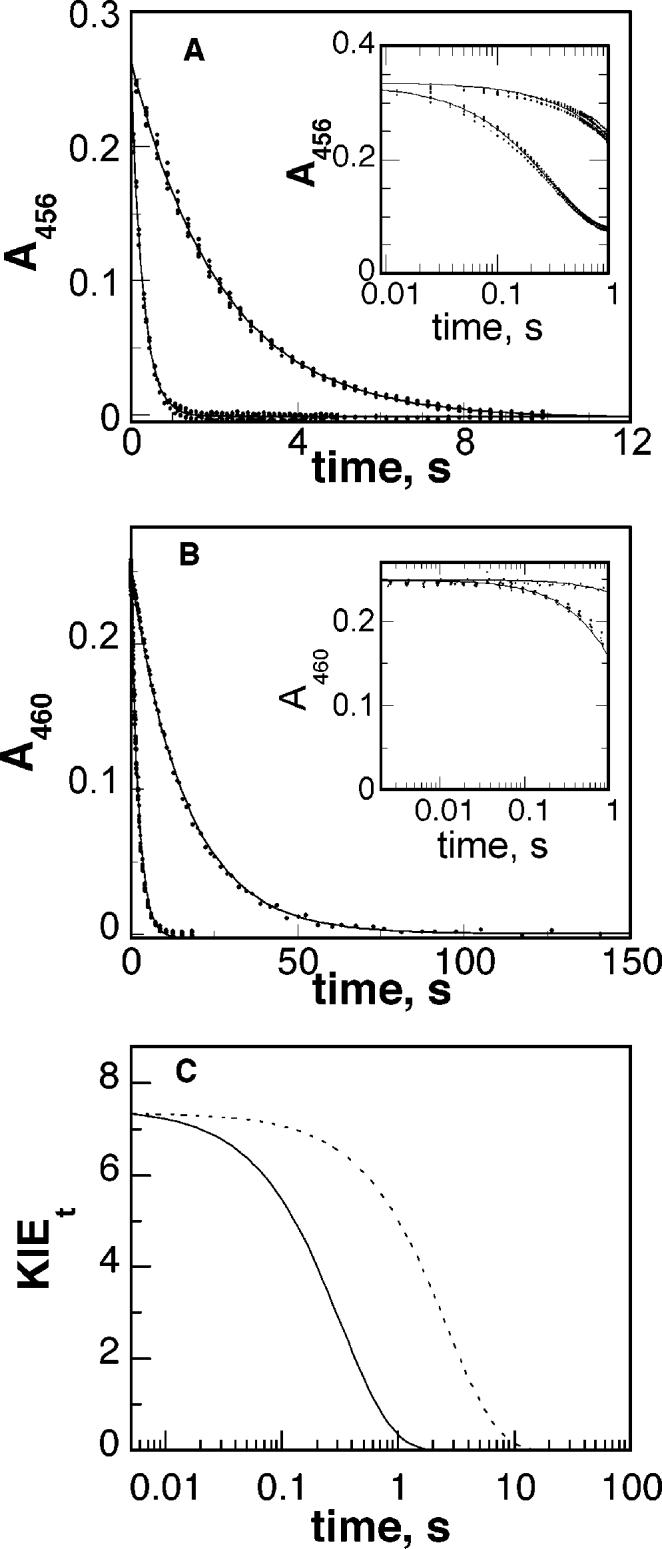
Figure 3.

Representative time courses of flavin reduction by protiated and deuterated sarcosine at pH 9.4 (A) and 8.0 (B). Reactions contained 250 mM sarcosine (bottom curve in each panel) or deuterated sarcosine (top curve in each panel). The inset shows the first second on a logarithmic time scale. The lines are from the fits of the data to eq 7. Conditions were as described in Table 3. (C) Transient isotope effect for flavin reduction at pH 9.4 (⋯) and 8.0 (—).
