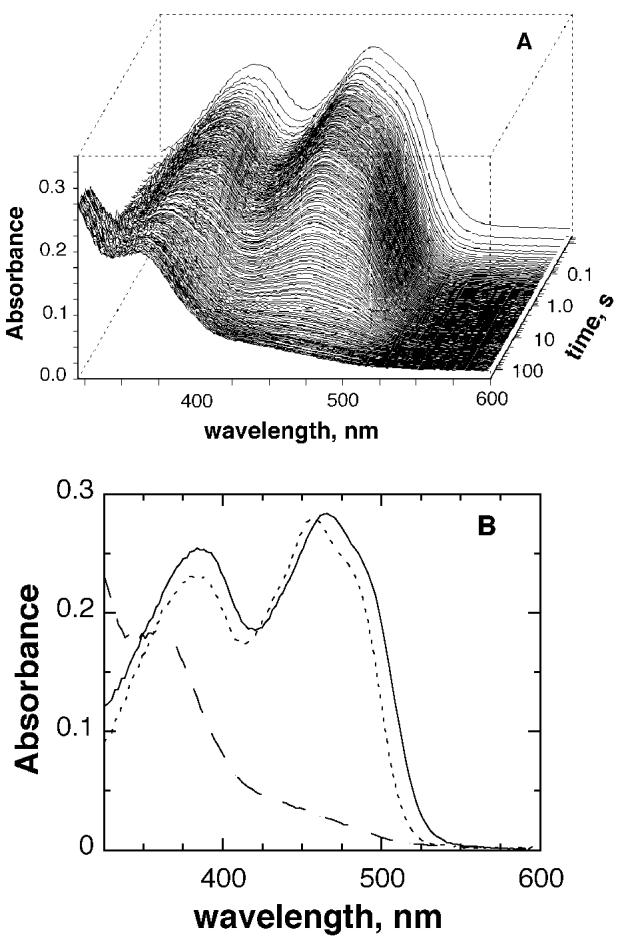
Figure 4.

(A) Changes in the absorbance spectrum of the enzyme-bound flavin during anaerobic reduction of MTOX by deuterated sarcosine at pH 8.0. The conditions were as described for Figure 3. (B) Extrapolated starting (—) and final (- - -) spectra, obtained by global analysis of the spectra using a single-step kinetic model, and the spectrum of the free enzyme (⋯).
