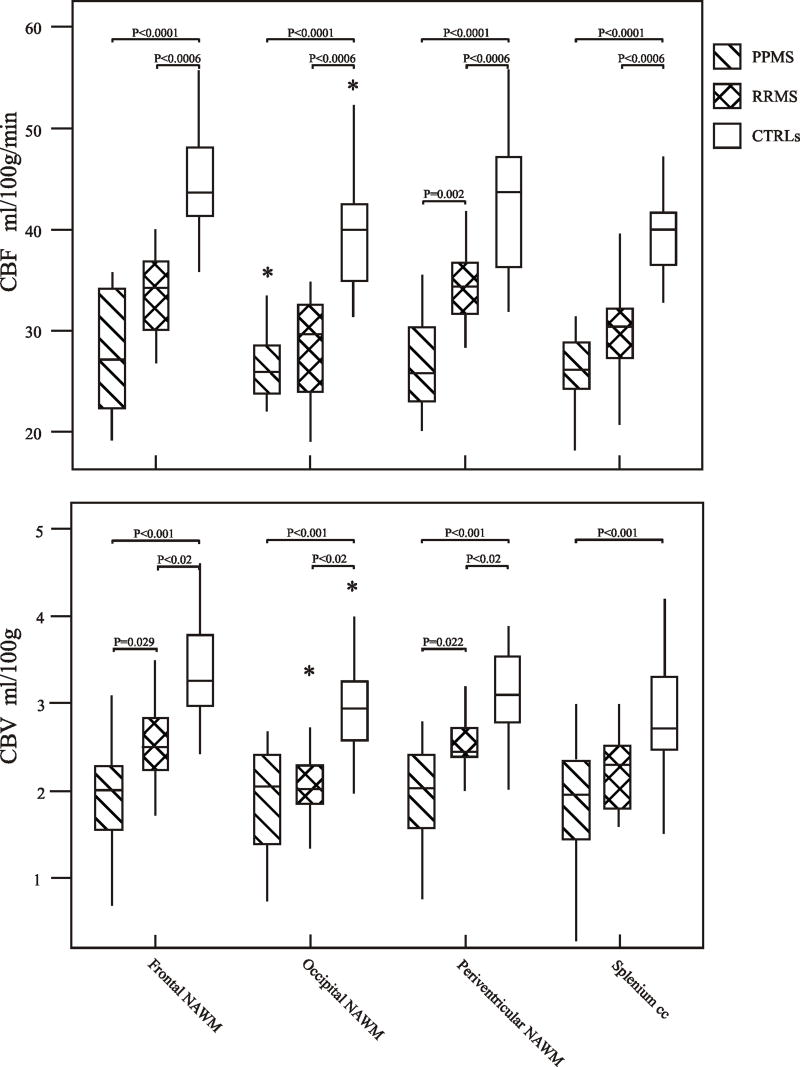
Fig. 2.
Top: Box plots display the 25%–75% values (boxes) ± 95% values (whiskers), median values (horizontal lines within boxes), and outliers (*) of absolute CBF value distribution in regions of frontal, periventricular, occipital NAWM and splenium of the corpus callosum among patients with PP-MS (hatched box), with RR-MS (crosshatched box) and in healthy controls (empty box).
Bottom: Box plots display the 25%–75% values (boxes) ± 95% values (whiskers), median values (horizontal lines within boxes), and outliers (*) of absolute CBV value distribution in regions of frontal, periventricular, occipital NAWM and splenium of the corpus callosum between patients with PP-MS (hatched box), with RR-MS (crosshatched box) and in healthy controls (empty box). Only significant p values are reported.
Note that the median CBF and CBV values in PP-MS patients are lower than those in RR-MS patients, which in turn, are lower than those in controls.

