
Fig. 3.
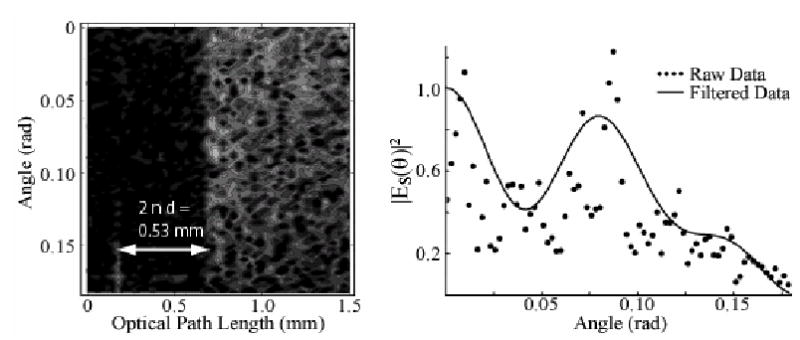
Axial spatial cross-correlation function for coverslip sample as a function of depth and angle. Note width of coverslip is correctly determined. Right plot shows angular distribution taken by ensemble averaging over 0.2 mm (~ 1 MFP) closest to surface (points). Low pass filter allows a noise reduction (line).