
Fig. 3.
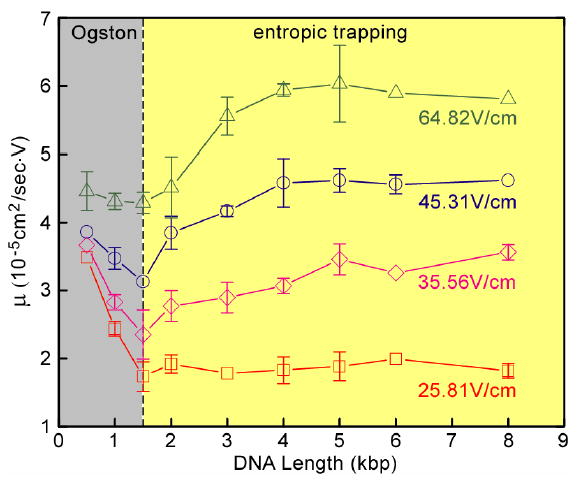
Mobility μ as a function of DNA length. DNA fragments were extracted after agarose gel separation. The nanofilter array has ds=73 nm, dd=325 nm, p=1 μm. The relative large statistical error bars (drawn if larger than the symbol) is likely due to the low DNA concentrations. The grey and yellow areas indicate Ogston sieving and entropic trapping, respectively. The transition points are marked with the vertical dashed line drawn for DNA length=1.5-kbp.