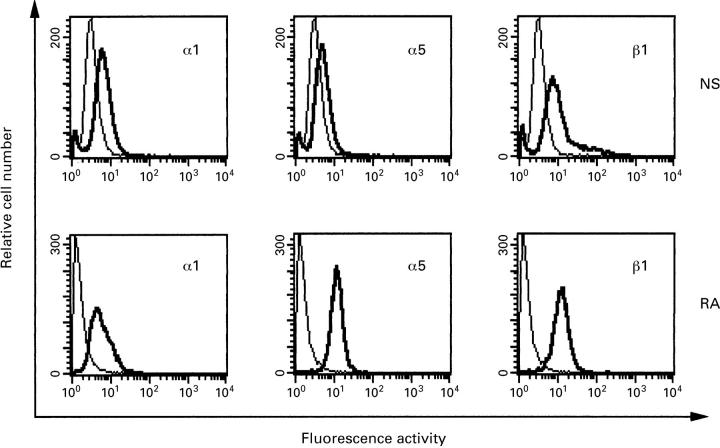
Figure 1 .
Histograms of flow cytometric analysis for the α1, α5, and β1 integrin subunits on fibroblast-like synoviocytes (FBS) from normal synovium (NS, upper panels) and from rheumatoid arthritis (RA, lower panels). The fluorescence obtained with isotypic negative control antibodies is plotted as a plain line, the results with anti-integrin antibodies as a bold line.

