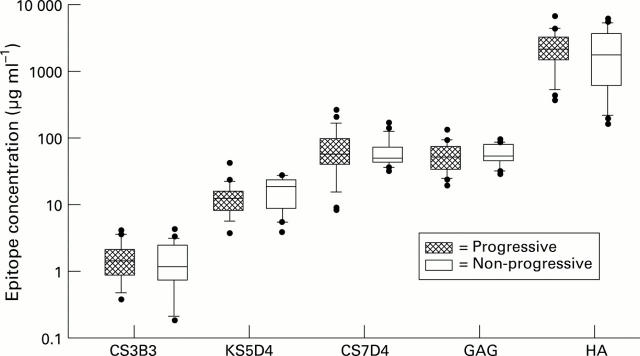
Figure 1 .
Comparison between progressive and non-progressive groups for all epitopes measured. The central solid line represents the median, with the box representing the middle 50% of the data. The error bar cap lines mark the 10th and 90th centiles. Dots represent individual data points outside the 10th and 90th centiles. CS3B3, chondroitin sulphate epitope 3B3; KS5D4, keratan sulphate epitope 5D4; CS7D4, chondroitin sulphate epitope 7D4; GAG, total sulphated glycosaminoglycans; HA, hyaluronan.

