
Figure 3 .
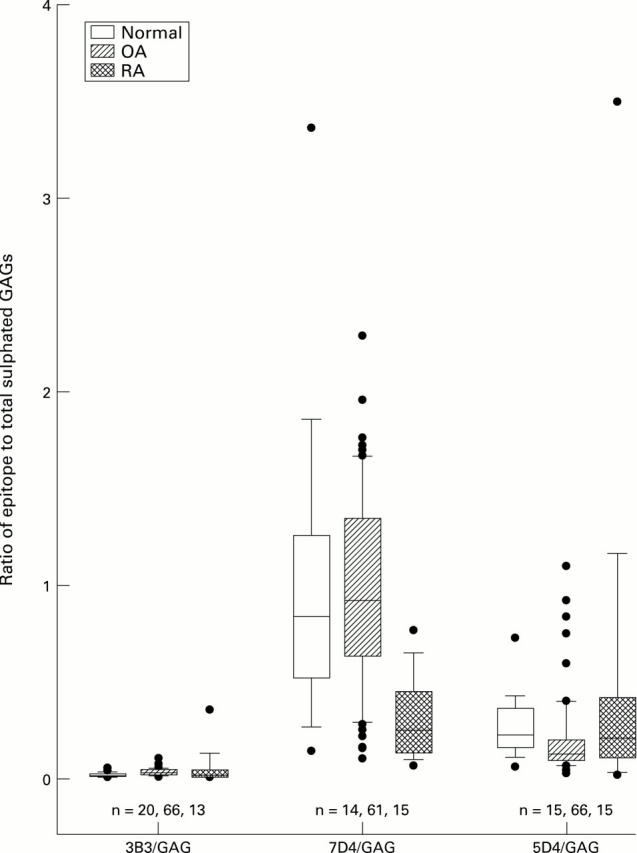
Comparison between RA, OA, and normal knees for ratio of chondroitin sulphate and keratan sulphate epitopes to total sulphated glycosaminoglycans. The central solid line represents the median, with the box representing the middle 50% of the data. The error bar cap lines mark the 10th and 90th percentiles. Dots represent individual data points outside the 10th and 90th percentiles.