
Figure 3 .
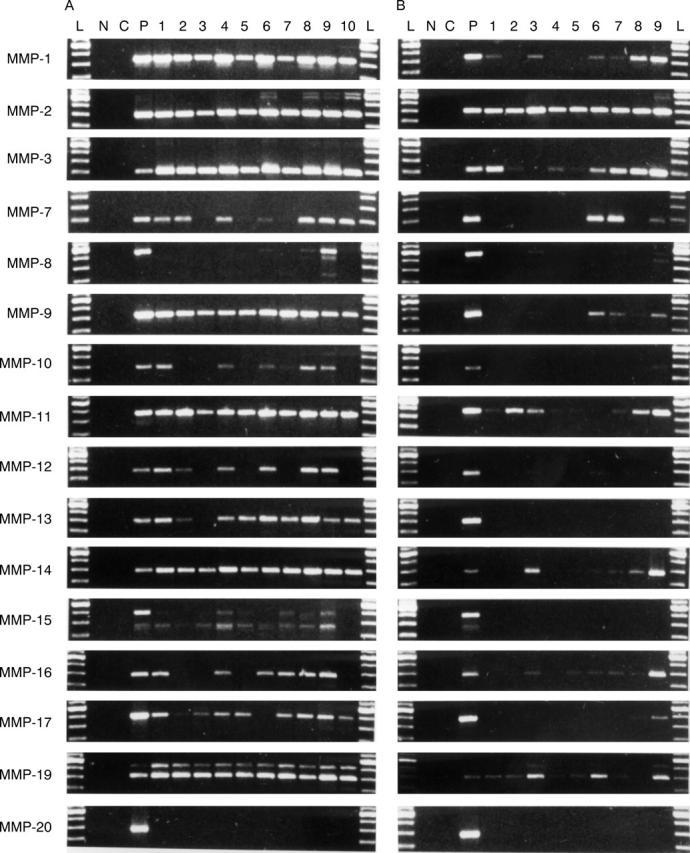
Reverse transcriptase polymerase chain reaction (RT-PCR) analysis of MMP-1 through MMP-20. (A) Ten synovitis tissue samples from RA patients (lanes 1-10). (B) Nine control non-arthritic knee injury samples (lanes 1-9). Samples are in the same order as in figure 2. It should be noted that the weakest bands are not visible in the photographic reproductions. Therefore, all data given in the results section and in table 3 are based on observations made from the original gels and photographs. L indicates 100 bp DNA ladder, starting from 300 bp; N for negative PCR control without sample; C for negative PCR control without sample and primers; and P for positive PCR control.