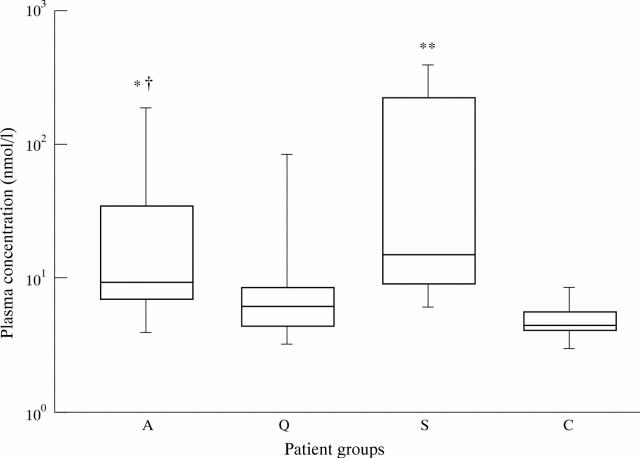
Figure 1 .
Box and whisker plots indicating the overall range (error bars), 25-75% range (boxes), and median value (horizontal lines) of neopterin plasma concentrations in patients with WG (A: active disease, Q: quiescent disease) compared with concentrations in patients with sepsis (S) and healthy controls (C). * p < 0.05, ** p < 0.0001 compared with healthy controls, † p = 0.074 compared with quiescent disease.

