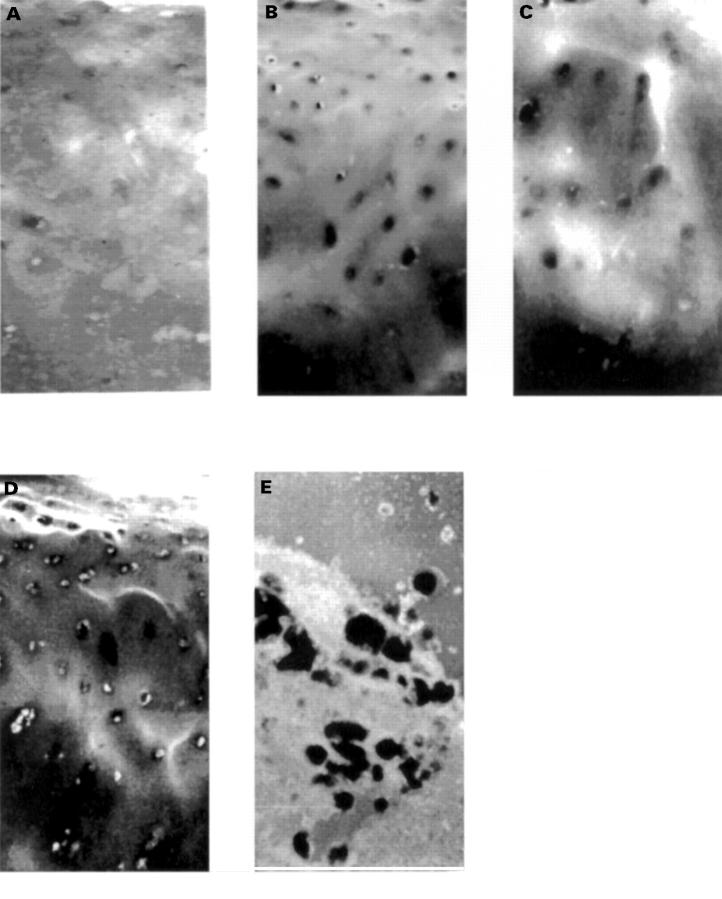
Figure 2 .
Representative figures of the collagenase II ISZ to illustrate the appearances of the ISZ reaction. All the figures are from the same grade 1 cartilage specimen. (A) is time 0 and (B) is 48 hours with no inhibitors. (C) is a serial section reacted with MSI. It shows decreased reaction area. (D) is a similar area to (B) viewed in dark field Nomarski optics and shows the nuclei of the chondrocytes particularly well. All images taken at × 100 magnification. (E) is the positive control, rheumatoid synovium, also at 48 hours. Note the areas of gel digestion below regions of the subintima and a villous surface projection × 250.

