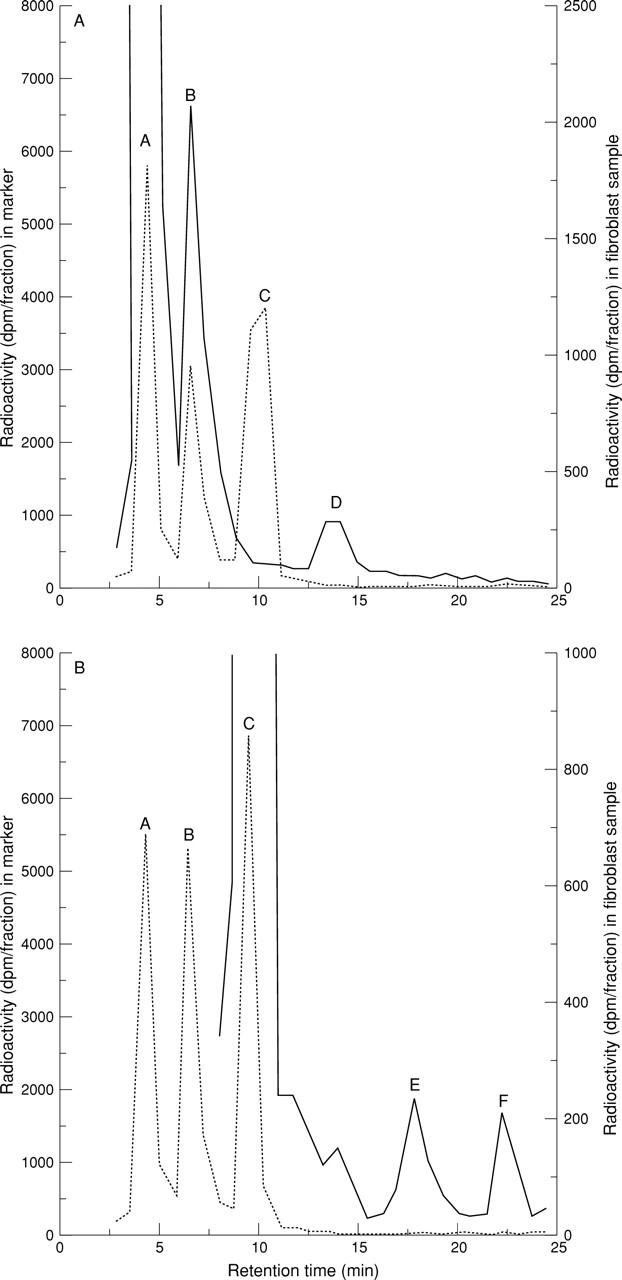
Figure 2 .

HPLC profile of synovial fluid fibroblast (A) [3H]-25-(OH)D3 and (B) [3H]-1,25-(OH)2D3 metabolism. HPLC conditions are as described in Methods. The dotted traces show the positions of known tritiated forms of 25-(OH)D3 (peak A), 24,25-(OH) 2D3 (peak B), and 1,25-(OH) 2D3 (peak C). As no radioactive tracer was available, the expected position of a tritiated 1,24,25-(OH) 3D3 peak was calculated using an ultraviolet trace of unlabelled markers in conjunction with the radioactive trace above. The solid trace in figure 2 (A) shows the metabolism of substrate [3H]-25-(OH)D3 to its 24-hydroxylated form, [3H]-24,25-(OH)2D3, by synovial fluid fibroblasts pre-treated for 24 hours with 10-8 M 1,25-(OH) 2D3. The position of an unidentified product, which was more polar than [3H]-24,25-(OH) 2D3, is indicated by peak D. The solid trace in figure 2 (B) shows the metabolism of substrate [3H]-1,25-(OH)2D3 by synovial fluid fibroblasts pre-treated for 24 hours with 10-11 M 1,25-(OH)2D3. A metabolite with an elution time representing that of [3H]-1,24,25-(OH)3D3 is shown by peak E and the position of an unidentified product, which was more polar than [3H]-1,24,25-(OH)3D3, is indicated by peak F; dpm = disintegrations per minute.
