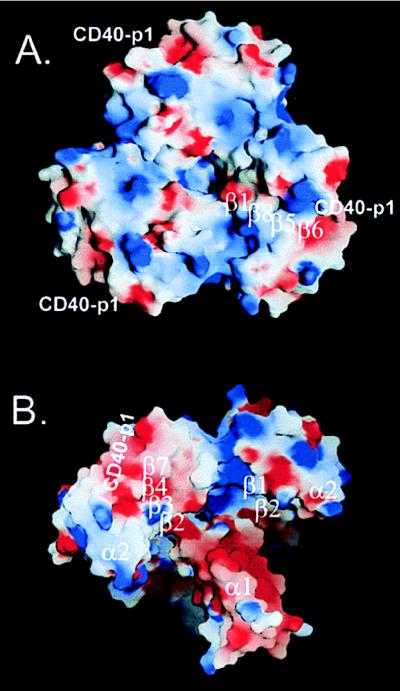
Figure 2.
Surface features of TRAF2-311–CD40-p1. Electrostatic potential of the complex mapped on the molecular surface. The potential (−5 to +5 kT/e) was calculated with grasp (24) and displayed with blue (positive), white (neutral), and red (negative). Surface hydrophobicity is generally highest in the white regions. The position of CD40-p1 and the strands underlying the surface are indicated. (A) View along the trimer axis looking onto the “top” of the TRAF-C domain. Large indentations in the molecular profile mark the subunit interfaces. Overall, the trimer is polarized with positive potential facing the membrane. (B) Oblique view of the “underside” of the TRAF2-311–CD40-p1 complex with the coiled coil pointing toward the bottom right. Positive potential characterizes sides of the canyons that exit the bowl along the subunit interfaces. The coiled coil is ringed with negative potential.

