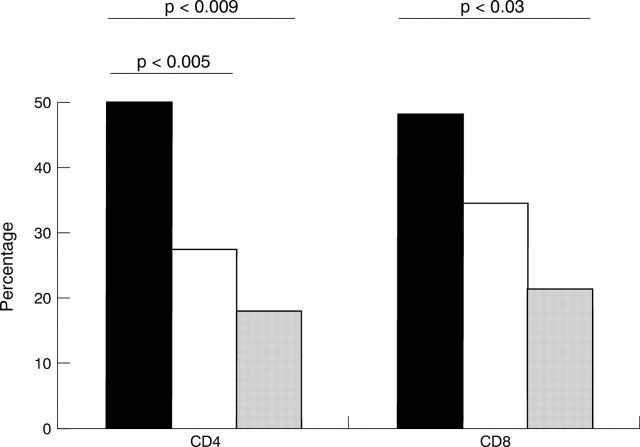
Figure 1 .
Differences in Vβ repertoire in CD4+ and CD8+ T lymphocytes in the different study groups. Concordant twin pairs are shown in black, discordant twins in white and the healthy twins in grey. The y axis gives the percentage of significant differences in the Vβ repertoire in relation to the number of comparisions made. Significant differences were observed in 28 of 56 comparisons (50%) for CD4+ T cells in concordant twins (4 concordant twin pairs, 14 Vβ families tested) compared with 27 of 98 comparisons (27.5%) between discordant twins (7 discordant twin pairs, 14 Vβ families tested; p<0.005).

