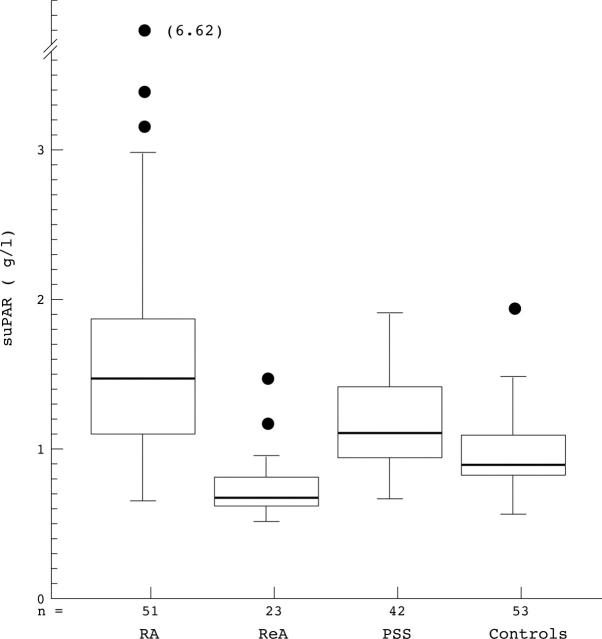
Figure 1 .
suPAR concentrations in different patient groups shown in box plots. Medians (heavy lines in boxes) and interquartile range are indicated as boxes. Whiskers indicates total range excluding outliers, which are shown separately. RA: rheumatoid arthritis. ReA: reactive arthritis. PSS: primary Sjögren's syndrome.

