
Figure 2 .
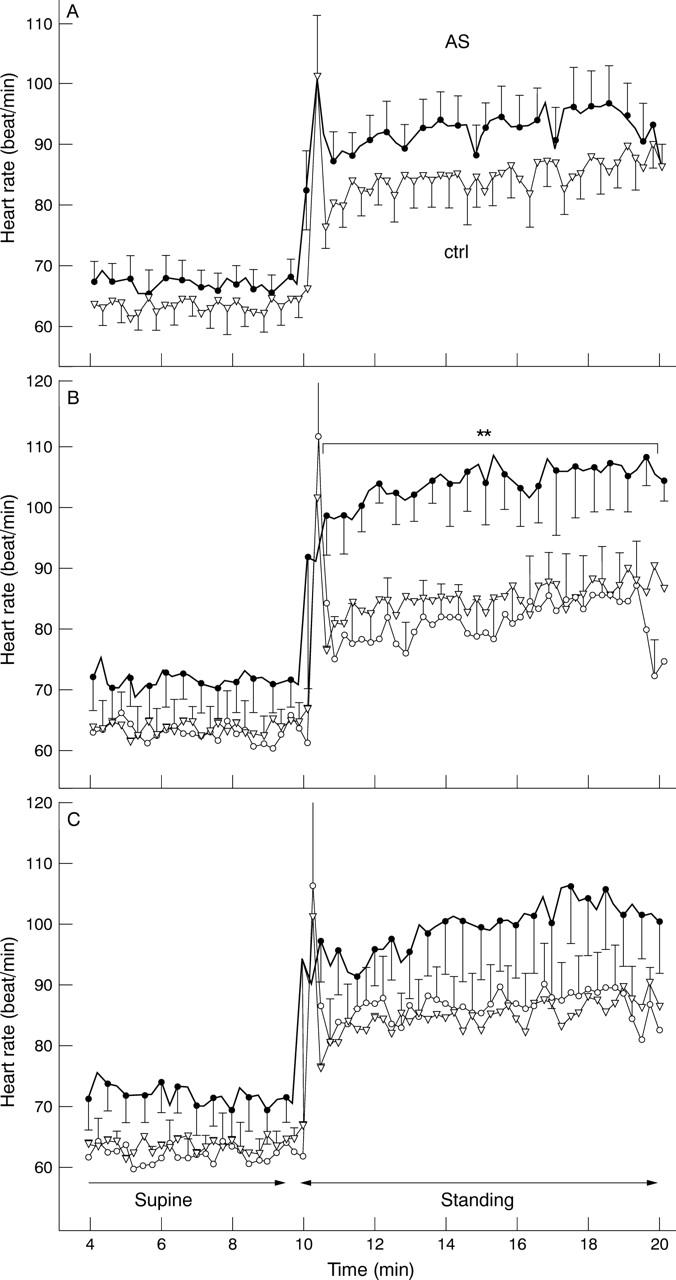
Time series average values of heart rate in 13 control subjects (control, light triangles and thin lines) and 18 patients with ankylosing spondylitis (AS, thick lines in the A panel) at the end of a supine 30 minute period and during 10 minutes after standing up. Vertical bars indicate group SEM. For clarity of the figure, only one average value has been plotted each 15 seconds, from the beat by beat individual records. In panels B and C thick lines are for average HR values of AS patients with BASDAI score > 5 (n = 10) and ESR > 20 mm 1st h with CRP > 20 mg/l (n = 8), whereas thin lines and light empty circles represent average values for AS patients with BASDAI score lower than 5 (panel B) and patients with ESR < 20 mm 1st h and CRP < 20 mg/l (panel C). Patients with lower criteria of inflammatory disease have clearly HR values values similar to control subjects, and during standing the average values of patients with BASDAI score > 5 were higher than their counterparts with BASDAI < 5 and the controls (panel B, p < 0.02).