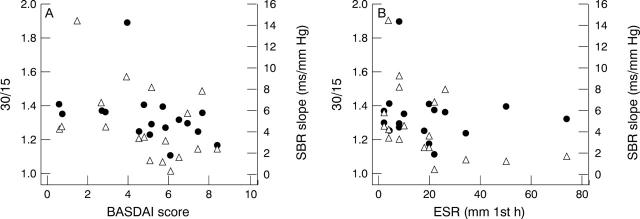
Figure 4 .
Scatter plots of individual values of RR interval 30/15 ratio (left vertical axis; empty triangles) and standing measured slope of spontaneous cardiac baroreflex (SBR; right vertical axis; black circles) against BASDAI score (panel A) and ESR (panel B) on horizontal axis. Spearman rank correlation coefficients were significant between SBR and BASDAI score (r = −0.56, p < 0.03), and between 30/15 index and ESR (r = −0.55; p < 0.03).

