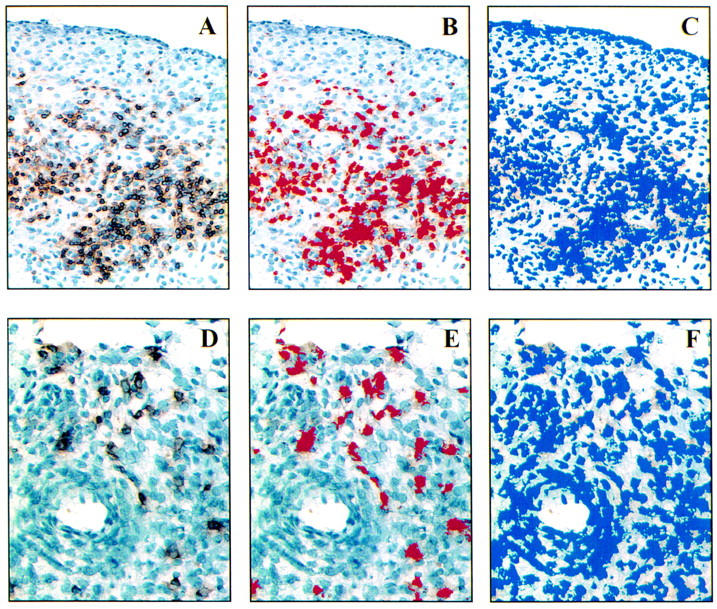
Figure 2 .

Automated measurement of CD3+ and CD8+ cell infiltration. The panels illustrate the interactive steps in the computerised image analysis routine for quantifying areas occupied by CD3+ cells (A, B, C) and CD8+ cells (D, E, F). Panels on left (A and D) demonstrate the digital images of stained cells acquired from the microscope. The middle panels (B and E) outline in pseudocolours the area occupied by immunohistochemically stained cells as judged by the computer. Panels on right (C and F) illustrate the total area of haematoxylin stained nucleated cells outlined in pseudocolours. The area occupied by CD3+ cells is 18 200 µm2 (B) and of total haematoxylin stained 53 100 µm2 (C) representing an incidence of 34.3% CD3+ cells in this area. CD8+ cells covers an area of 3400 µm2 (E) and total cells 29 700 µm2 (F), indicating 11.4% CD8+ T cells in this field.
