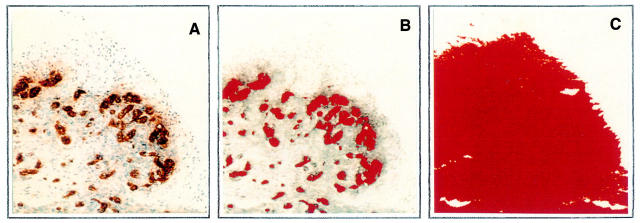
Figure 3 .
Automated measurement of vascularity. Following staining with von Willebrand factor the left panel (A) represents the digital image of blood vessels acquired from the microscope. The middle panel (B) outlines in pseudocolour the area occupied by the blood vessels, including the endothelial cells and lumen. The right panel (C) illustrates the total tissue area analysed for vascularity depicted in red pseudocolour by the computer. The blood vessels occupy an area of 29 300 µm2 (B) while the total tissue area is 143 000 µm2 (C), meaning that the vascular area in this field represent 20.5% of the total area.

