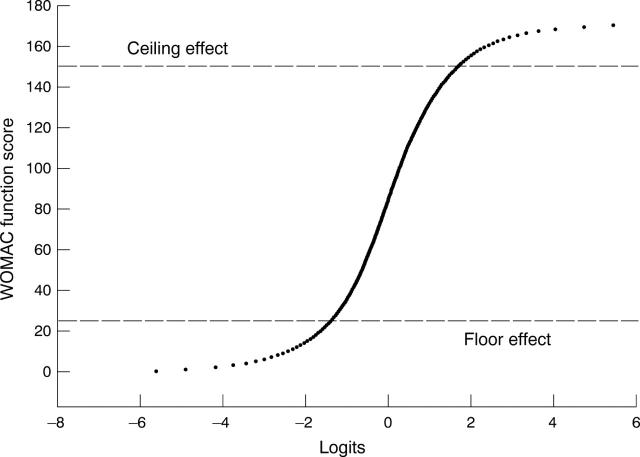
Figure 4 .
Plot of severity in logits versus WOMAC functional score for OA. Curves are similar in RA and fibromyalgia. The WOMAC function score is linear over the range of 25-150 (equivalent range on 0-10 scale is 1.5-8.8). Less than two per cent of patients have scores greater than 150. Twenty one per cent have scores less than 25 (see fig 1).

