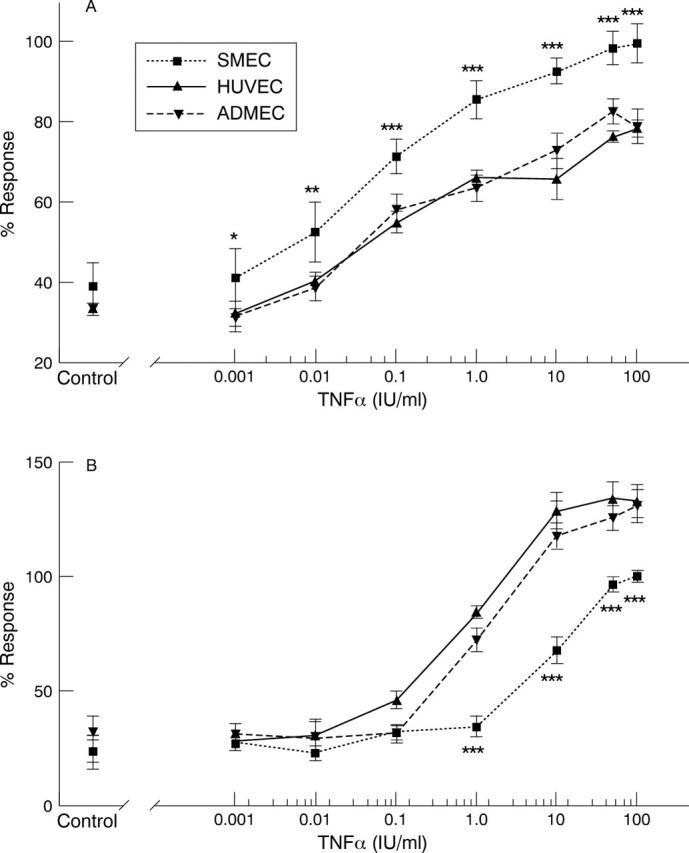
Figure 2 .

(A) HUVEC, ADMEC and SMEC monolayers were stimulated TNFα (0-100 IU/ml) for six hours before assessment of E-selectin expression. Results are normalised as percentages of the optical density observed in SMEC cultures stimulated with 100 IU/ml TNFα and depict 95% confidence intervals for the mean response. E-selectin expression by SMEC was compared with both HUVEC and ADMEC. SMEC display significantly (p<0.05*, p<0.01**, p<0.001***) higher E-selectin expression than HUVEC or ADMEC at all concentrations of TNFα, (n=3). (B) HUVEC, ADMEC and SMEC monolayers were pre-incubated with TNFα (0-100 IU/ml) for six hours before assessment of VCAM-1 expression. Results are normalised as percentages of the optical density observed in SMEC cultures stimulated with 100 IU/ml TNFα and depict 95% confidence intervals for the mean response. VCAM-1 expression by HUVEC and ADMEC was not significantly different. SMEC display significantly (p<0.001***) lower VCAM-1 expression than HUVEC or ADMEC at concentrations of TNFα in excess of 1 IU/ml, (n=3).
