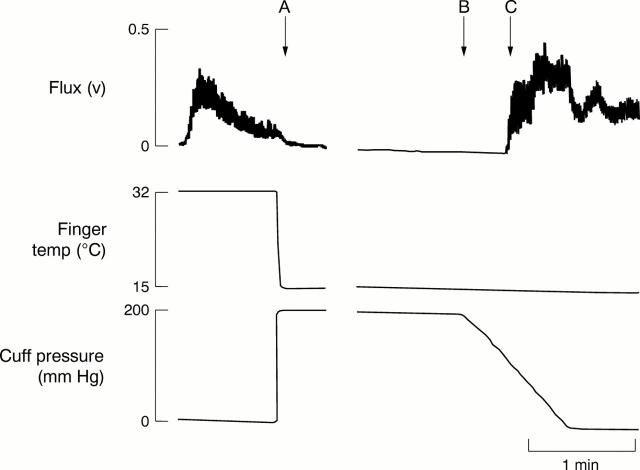
Figure 1 .
Measurement of finger systolic pressure after digital cooling in a control subject. The upper trace shows flux in fingertip skin. The middle trace shows temperature around the middle phalanx of the finger. The bottom trace shows pressure in the cuff surrounding the proximal phalanx. A = proximal cuff inflation to 200 mm Hg with simultaneous middle phalangeal cooling to 15°C abolishes flux; B = after five minutes' cooling, gradual cuff deflation; C = return of flux at cuff pressure of 120 mm Hg. Part of the recording during cooling and occlusion between A and B has been omitted.

